Custom Search
RECENT POSTS

Thursday, April 4, 2019

pH meters (hydrogen ion concentration)


Acids and bases are significant in food and chemical industries, water and sewage treatment, biology, medicine, etc. Therefore, we need to be able to measure concentration and strength of acid and base solutions. Instrumentation has been developed to measure pH of solutions using special selective electrodes that can develop an electromotive force, which is proportional to the hydrogen ion concentration in the solution where these electrodes are immersed.

What we understand under the term of pH? How is it related to the concentration and strength of solutions?

It is known, that acids and bases produce conductive solutions, when dissolve in water, because charged ions are formed. Here are ionisation equations for hydrochloric acid and sodium hydroxide dissolved in water:


If we mix these two aqueous solutions, the acidic and basic properties of the solution will be lost, so the neutralisation reaction occurrs:


Water is formed as the result of this reaction. However, the resulting solution is still conductive, because of the presence of sodium and chloride ions. If the quantities of initial acid and base are equal, then this resultant solution will be neither alkaline, nor acid.

In the case of dissociation of pure water, ions of hydrogen and hydroxyl are formed:

Pure water is very weak regarding to dissociation. So, very small amount of water molecules break into ions. The symbol Û  in (7.4) indicates that the process consists of two reactions, namely, dissociation of molecules into ions and recombination of ions into molecules. 


Fig 7.6A : Dissociation and formation of hydronium.

For pure water the rates of these two reactions are equal, and we can write an equilibrium equation as follows:

where,


Since pure water is neutral, then according to (7.5) the activity of hydrogen and hydroxyl ions should be equal, ie, 10-7  mole/l. No matter what compounds form an aqueous solution, the product of activities of hydrogen and hydroxyl ions should always be equal to 10-14  mole/l at 25 °C.
With an addition of a strong acid (such as HCl) to pure water we add many hydrogen ions. As the result of this addition, the number of hydrogen ions will increase, let’s say to 10-2  mole/l, and the activity of hydroxyl ions then will be equal 10-12  mole/l. As we can see, the product of activities is still equal to 10-14  mole/l at 25 °C.

Since the use of ion activities in the form of a power representation is not convenient, a Danish biochemist S.P.L. Sørensen in 1909 proposed to use the expression of pH, which was originally derived from the phrase “power of hydrogen”. The pH is defined as a negative common logarithm (with the base of ten) of the hydrogen ion activity, as follows:

Therefore, the pH of pure water is equal to 7 at 25 °C. Acid solutions contain more hydrogen ions than hydroxyl ions, so the activity of hydrogen ions will be greater than 10-7 , that is, 10-610-510-410-3, etc., with pH equal to 6, 5, 4, 3, etc., respectively. pH values for basic solutions will be 8, 9, 10, 11, etc., respectively.

Instrumentation for pH measurements use an electrometric method. A glass pH-responsive electrode immersed in a solution under measurement will vary electric potential (voltage) on the boundary between the electrode and solution as a function of pH of this solution. However, it is not possible to measure the potential between this electrode and solution only. Why? Because when we connect a measuring device, another potential is developed between the solution and a conductor which connects the measuring device and the solution, this new potential being also dependent on the pH of the solution. Therefore, we need to use one more electrode, the reference electrode, which potential is not dependent on the pH of the solution. In order to make the potential of the reference electrode not dependent on the pH of the solution, it should be filled with a saturated solution.


Figure 7.6. Schematic of a pH-meter with the glass and reference (calomel) electrodes.
Fig. 7.6 shows schematic of a pH-meter. A glass electrode 1 and a reference electrode 2 are immersed in a solution 3 under measurement. The potential difference between these two electrodes which is proportional to the pH of the solution is measured by a potentiometer 6. The glass electrode is filled with the solution 4 with a known value of pH. A silver-silver chloride electrode 5 is placed inside the glass electrode. The reference electrode presents a dielectric enclosure 2 filled with pure mercury 7. A low soluble mercury-mercury chloride 8 (calomel) is placed above mercury. The reference electrode is filled with a saturated solution 9 of KCl. A semipermeable membrane 10 is used to produce an electrical contact between KCl solution and the solution under measurement 3. Potassium chloride diffuses or leaks into the solution under measurement, so the concentration of KCl in the reference electrode is not changed. An electrical circuit consists of several elements connected in series, and an overall electromotive force is equal to the sum of these potentials, as follows:


where,

ES - the overall electromotive force developed in the circuit, mV;
E1 - potential between a silver-silver chloride electrode and the solution 4, mV;
E2 - potential between the solution 4 and an internal surface of the glass electrode, mV;
E3 - potential between mercury and calomel in the reference electrode, mV;
Ex - potential between an outside surface of the glass electrode and the solution under measurement, mV.
E1, E2 and E3 are not dependent on the pH of the solution under measurement, but vary with temperature. Ex depends on the pH of the solution under measurement and its temperature, and can be evaluated by the Nernst equation:
where,
R - the gas law constant, R = 8.31451 J/(mole*K);
T - absolute temperature of the solution under measurement, K;
F - Faraday’s number, F = 96485.309 C/mole, C - coulomb.

The overall electromotive force at a constant temperature is the function of the pH of solution only. However, one need to introduce a temperature compensation element (usually a suitable packaged resistor, thermistor, or resistance temperature detector), which is placed close to the glass electrode in the solution under measurement and connected to the electrical circuit for electromotive force measurement.

Article Source:: Dr. Alexander Badalyan, University of South Australia

Read more...

Electrolytic conductivity meters


An operational principle of electrolytic conductivity meters is based on the relationship between electrical conductivity and concentration of solutions.

The ability to conduct electricity is called electrical conductance, which is reciprocal of electrical resistance:


electrical conductance = 1/electrical resistance.

The unit for electrical conductance is Siemens: 1S = 1/Ohm.

Electrical conductivity is equal to electrical conductance of a volume of the material of unit length and area:

electrical conductivity = electrical conductance*length/area.

The unit for electrical conductivity is S/m. Few solutions exhibit electrical conductivities as great as 1 S/cm. So, the most commonly used units are mS/cm and mS/cm.

Electrolytic conductivity is usually defined as electrical conductance of a unit cube of solution as measured between opposite faces. It has the same units as electrical conductivity.

In conductive or electrolytic solutions positive ions (cations) move toward the cathode, and negative ions (anions) move toward the anode. Reduction and oxidation take place on the cathode and anode, respectively. Electrolytic conductivity of a solution mostly depends on the concentration and mobility of all ions in the solution. The latter depends on the ion size, charge, dielectric constant of the solvent, temperature and viscosity of the solution. Electrolytic conductivity of a mixture of solutions is proportional to the sum of relative concentration of each components and the mobility of ions. Therefore, conductivity meters are used for electrolytic conductivity measurements of one component solutions only. Fig. 7.4 shows typical conductivity curves for NaCl solution in water.


Electrolytic conductivity is usually measured by placing electrodes in contact with an electrolytic solution. In this case electrical conductance between electrodes is related to electrolytic conductivity of the solution. Since the conductivity cell has unchanged dimensions, so by measuring electrical conductance of the solution in this cell, and thus determining the cell constant, we can relate thus measured electrical conductance to the actual value of electrolytic conductivity.


Fig. 7.5 schematically shows an electrolytic conductivity meter, which employs an alternating current Wheatstone bridge in order to avoid polarisation of measuring electrodes. A conductivity cell is immersed in the solution 1. This cell consist of an insulating shield 2 made of either glass or epoxy, or polystyrene, or Teflon. Two metal electrodes 3 are placed inside this shield. These electrodes are made of either stainless steel or nickel, or platinum, or gold, or platinum-plated metals. The shield is perforated to provide good contact of solution with these electrodes. The operational principle of a Wheatstone bridge is described in 3.5. We measure an electrical resistivity (r) of the electrolytic solution between cell electrodes. An electrical resistivity is defined as an electrical resistance of a conductor of unit cross-sectional area and unit length, as follows: r=R*A/L, (Ohm*m), where, R is the electrical resistance of the conductor (Ohm), A is the cross-section area of the conductor (m2), and L is the length of the conductor (m).


Figure 7.4. Electrolytic conductivity of NaCl solutions. 

Since temperature of an electrolytic solution has influence on its electrolytic conductivity, therefore, we should be able to introduce temperature correction (compensation). For this purpose an electrode sensor filled with a reference liquid, which has a thermal coefficient of electrolytic conductivity approximately equal to that of the measuring solution, is employed. This sensor is immersed in the measuring electrolytic solution near the measuring conductivity cell, and through conductors is connected to the side of the bridge adjacent to that side of the bridge which is connected to the measuring conductivity cell. Since temperatures of the conductivity measuring cell and the sensor cell are equal, then variations of temperature of the electrolytic solution will not have influence on the results of electrolytic conductivity measurements.


Figure 7.5. Electrolytic conductivity meter.


Article Source:: Dr. Alexander Badalyan, University of South Australia

Read more...

Tuesday, March 5, 2019

On-line chromatographic analysis


As early as 1903-1906 a Russian botanist Mikhail Tsvet (Lecturer in the Warsaw University) performed experiments trying to separate pigments of plants. Using a solvent, petroleum ether, he washed the pigments through a vertical glass tube filled with a powder-like absorbent, calcium carbonate. As the result of this procedure, he obtained a series of coloured absorption bands. He first used a term ‘chromatography’ to describe this method. Word ‘chromatography’ consists of two words ‘chromatos’ (in Greek language means ‘colour’) and ‘grapho’ (in Greek language means ‘writing’), and means ‘colour writing’. By coincidence, the surname ‘Tsvet’ in Russian language means ‘colour’.


Chromatography methods are classified regarding to the types of moving and stationary phases according to Figure 7.1. (from Considine D. M. Process Instruments and Controls Handbook. McGraw-Hill Book Company, Sydney, 1985, p. 6.170).


Figure 7.1. Classification of chromatography methods. 


Physical absorption principles for separating of various components from a mixture of chemical substances form the basis of chromatography (see Fig. 7.2). A gas mixture 1 to be analysed is carried through a tube or column 2 by an inert carrier gas (nitrogen, helium) 3. The gas mixture and the carrier gas form the moving phase. The column is filled (packed) with materials 4, the stationary phase, which will absorb gases. Different components of the gas mixture are delayed for varying increments of time. After the column, the separated gases 5 pass through a gas detector (flame ionisation detector, or thermal conductivity detector) 6. This detector develops a signal 7, which then is transformed to the chromatogram 8. Using this chromatogram we can determine the type of a component and its quantity. In order to achieve better separation of components from various mixtures different types of packing materials should be chosen. The absorption of components by the stationary phase is highly dependent on the operational conditions. Therefore, temperature, flowrate and pressure of a carrier gas, sample valve timing, and detector sensitivity should be carefully controlled.

Chromatographs are widely used for composition measurements of gaseous and liquid mixtures. Usually they are complex laboratory equipment. Modern on-line chromatography systems for continuous, repetitive and fully automatic gas analysis have been developed, and in principle have all essential elements inherent to laboratory-type equipment. Fig. 7.3 schematically shows an operational principle of an on-line gas-chromatograph.


Figure 7.2. Schematic of a gas-chromatograph (gas-solid chromatography). 


A sample of a gas mixture 1 is withdrawn continuously from a process unit 2 and through a shutoff valve 3, filter 3a (for removing of particulate matter) and pressure regulator 4 (for reducing pressure to a lower constant value) circulates through a sample conditioning unit 5. After the sample conditioning unit the stream enters the process 6 through a shutoff valve 7 in the point of a lower pressure compared with the sample withdrawal point. The sample conditioning unit allows to calibrate the gas-chromatograph with the synthetic calibration blend from a container 8, through a pressure regulator 9, and to control flowrate. A carrier gas (nitrogen, helium) is supplied from a cylinder 10, and its pressure is controlled by a pressure regulator 11 and a pneumatic control section 12. An analyser 13 contains separating columns, flame ionisation and/or thermal conductivity detector(s) and a temperature control unit. A metering pump, which is placed in the sample conditioning unit, injects a small sample of an already conditioned gas mixture into the separating column, which is placed in the analyser. An electronic module 14 stores analytical programs in RAM and controls functions of the analyser. Analytical data are transferred from the electronic module to a data processor 15, where they are converted to analog signals. These signals are transmitted to a bar graph recorder16 and a number of trend recorders 17. A host computer 18 controls all actions of the chromatograph, receives results, alarm messages, stores application programs. A real-time chromatogram is printed on the printer 19

Here are several values of parameters of a chromatograph:
  • temperature in the temperature control unit - 40 to 200 °C;
  • accuracy of temperature control - ±0.2 °C;
  • total length of separating columns - 10 m;
  • diameter of separating columns - 3 mm;
  • flowrate of a carrier gas - 40 to 160 cm3/min;
  • volumes of samples of gas mixtures - 0.5, 1, 2, 4 cm3;
  • volumes of samples of liquid mixtures - 0.004, 0.008, 0.032 cm3;
  • pressure of a gas carrier - 400 kPa;
  • output signal - 4 to 20 mA.
An output signal from a gas-chromatograph is usually used as an input signal for a controller, which changes either process temperature or pressure or flowrate, etc., to bring a product composition to the desired value.


Figure 7.3. On-line chromatographic system.


Article Source:: Dr. Alexander Badalyan, University of South Australia

Read more...

Instrumentation for analytical measurements


With instrumentation used for analytical measurements in process environment we are able to define the content of chemical streams. So we can control the composition of intermediate and final products. Analytical instrumentation may be classified regarding to the measuring method employed, as follows:


Physical: 

  1. Gas and liquid chromatography; 
  2. Infrared analysers;
  3. Ultraviolet analysers;
  4. Turbidimeters;
  5. Densimeters;
  6. Viscometers;

Electrochemical: 

  1. Electrolytic conductivity meters
  2. pH meters (hydrogen ion concentration).
Operational principles of analytical instruments are based on the interactions between energy and matter. Matter is made of complex arrangements of particles. Each particle has its mass, electrical charge, or is neutral. Neutrons (with mass, but without electrical charge) and protons (with mass almost equal to that of a neutron and with a unit positive charge) form the nuclei of atoms, and determine their atomic weight, and chemical and physical properties of substance. Chemical properties are also characterized by the number of electrons (with negligible mass and with a unit negative electric charge) and their energy state. If we can observe the results of interaction (change of the energy state of electrons) between these electrons and energy from external source, then we will be able to obtain information about the composition of a particular substance. Among types of energy we can mention electromagnetic radiation, chemical reactivity, electric and magnetic fields, thermal and mechanical energy.


The links below will explain the instrumentation for analytical measurements in detail :


Article Source:: Dr. Alexander Badalyan, University of South Australia

Read more...

Tuesday, February 19, 2019

Ultrasound flowmeters


This method is based on the relationship between the flowrate of the stream and the velocity of ultrasound introduced in this stream. There are several modifications of this method, such as Doppler-effect method and transit-time method. The first one is based on the Doppler effect, saying that frequencies of received waves are dependent on the motion of the source or receiver (observer) relative to the propagating medium. We will describe the second method, which is shown schematically in Fig 6.6.

Figure 6.6. Transit-time flowmeter.


A source of ultrasound 1 is attached outside to the pipe 2 with a flowing fluid 3 inside it. A sonic beam is propagating the flowing fluid at a specific velocity, proportional to the properties of the fluid (temperature, pressure, and density). An ultrasound beam 4 will travel faster in the direction of flow, and slower in the opposite direction. This beam arrives in to the receiver 5 faster than an ultrasound beam 6 from the transmitter 7 to the receiver 8.


Transit time of ultrasound beam from transducer the 1 to the receiver 5 can be evaluated as follows (from Bentley J. P. Principles of Measurement Systems, Longman, 1995, p. 411-412):

(6.46)
Transit time of ultrasound beam from the transducer 7 to the receiver 8 can be evaluated as follows:(6.47)

Let’s evaluate the time difference:

(6.48)

The ratio , therefore,(6.49)


Using (6.49) we can reduce (6.48) to the following form:

(6.50)

where, 


These devices can not be used for flow measurements of fluids with air bubbles or solid particles, since they will interfere with the transmission and receipt of ultrasound radiation. These particles serve as reflectors of ultrasound radiation.

Article Source:: Dr. Alexander Badalyan, University of South Australia

Read more...

Turbine flowmeters


These flowmeters refer to velocity measurement devices, since the action (rotation) of their measuring element (turbine) is proportional to stream velocity, which, in its turn, is proportional to the flow of fluid in the pipe. Turbine flowmeters provide accurate measurements in the wide flow range. However, their application is limited to clean liquids. The name of this device comes from the operational principle of this flowmeter (see Fig. 6.5). 

Fig . 6.5A Basic Parts of the turbine flow meter


The housing of this device 1 is connected to pipes 2 and 3. A turbine 4, sometimes called a rotor, is placed co-axial in this housing in the path of the flowing liquid. This liquid imparts the force to the blades 5 of the rotor and causes the rotor to rotate on the shaft 6, which is connected with the housing by a support 7 with bearings. In order to straighten the stream of the passing fluid, several radial-straightening vanes 8 are placed on the shaft before the rotor in upstream direction. The rotational speed of the rotor is proportional to the fluid velocity only when a steady rotational speed of the rotor has been reached. If we measure the number of turbine wheel revolutions per unit time, then this will be a measure of flowrate. Therefore, we need to measure the number of rotor revolutions. Several methods are used to transmit rotor revolutions through the meter housing to the readout device, which is placed outside the housing. The first method employs a mechanical device, which by use of selected gear trains 9 transmits the rotation of the turbine directly to the register 10. Another, electrical method, employs a permanent magnet with several coils mounted close to the rotor but external to the fluid channel. When one blade of the rotor passes the coil, the total flux through the coil changes and a pulse of voltage is generated (one cycle of voltage). The frequency of voltage pulses is proportional to the fluid flowrate, and the total number of pulses is an indicator of the total flow.


Figure 6.5. Turbine flowmeter.

Article Source:: Dr. Alexander Badalyan, University of South Australia

Read more...

Venturi flow nozzle


There is another modification of the variable differential pressure technique for flowrate measurements. This technique employs a Venturi flow nozzle, which is shown schematically in Fig. 6.4. 


The Venturi flow nozzle is installed in pipes with internal diameter varying from 65 to 500 mm. It produces a large differential pressure with a minimum loss of static pressure. This nozzle is able to measure flowrates of fluids with suspended solids. However, Venturi flow nozzles are very expensive. It consists of three parts: a profiled inlet 1, a cylindrical throat 2, and a conical outlet 3. A pipes 4 and 5 are connected to the inlet and outlet of the Venturi flow nozzle. The nozzle may be long and short. In the first case the biggest diameter of the outlet cone Dcmax is equal to the internal diameter of the pipe  Dp, in the second case it is less than Dp. The restriction diameter of Venturi flow nozzles Dn ³ 15 mm. The differential pressure is measured as in the case for orifice flowmeters with the only difference, that the downstream pressure in the cylindrical throat is sensed through radially drilled holes 6.

Figure 6.4. Venturi flow nozzle.


Article Source:: Dr. Alexander Badalyan, University of South Australia

Read more...

Saturday, February 16, 2019

Rotameters


This type of device (see Figure 6.3) consists of a vertical tapered tube 1 (usually made of a glass or other transparent material) and a rotor 2 (or a float), usually made of a metal (aluminium, brass, stainless steel, etc.) with higher density than that of a fluid 3 being measured. 


The rotor is produced with slots to give it rotation, so the rotor can be placed co-axial inside the tube. When the flowrate of the fluid through the tube increases the rotor is elevated upwards until the balance between forces acting on the rotor is achieved. Since the tube is tapered, then the restriction area (the area between the wall of the tube and side surface of the float) will change to accommodate flow rate being measured. Therefore, for each value of the flowrate will correspond certain position of the rotor in the tube in respect to a scale 4 and a certain value of the restriction area. 
Figure 6.3. Variable area flowmeter (rotameter).


Let's consider forces acting on the rotor during balance:

 (6.40)

or

(6.41)
(6.42)
(6.43)

where,


Equation (6.43) shows that the difference of pressures is constant and is not a function of a flowrate. Therefore, this type of device sometimes is called the flowmeter with constant differential pressure.

An equation for the evaluation of the volumetric flowrate (m3/s) has final form as follows:

(6.44)

where,

φ         -- discharge coefficient taking into account friction of the fluid with the rotor and the tube, pressure losses due to vortex of fluid under and above the rotor, and changes of the stream form when it passes through the restriction area between the rotor and the tube;

Sgap    --the area of an annular gap (restriction) between the rotor and the wall of the tube, m2.

Sgap  is defined by the geometry of the float and pipe as follows:

(6.45)

where,


The accuracy of rotameters varies from±0.25 to ±2% (for individual calibration). Their repeatability is excellent. They can measure flowrates from 0.5 cm3/min to 1135 l/min of water.


Article Source:: Dr. Alexander Badalyan, University of South Australia

Read more...

Tuesday, February 12, 2019

Orifice plates


This method is based in the phenomenon that a stream of fluid (liquid, gas or vapour) when passing through the restriction or primary device (orifice plate, Venturi plate, flow nozzle, etc.) is subjected to the change of kinetic and potential energy of the stream during variations of flowrate. Figure 6.1 shows an orifice plate. 

Let’s consider two cases with incompressible and compressible fluids.


Case 1. Incompressible fluid.

The following assumptions should be considered when derive working equations:

1 - fluid is incompressible, and there are no phase changes when fluid passes through the orifice;

2 - fluid flow is steady and frictionless, ie. there are no energy losses due to friction;

3 - flow is isothermal, ie. no heat losses or gains due to heat transfer between the fluid and its surroundings;

4 - there is no in and outflow of energy between sections A  -  A  and B - B;

5 - mass flowrates in each cross-section of the stream is constant;

6 - pipe is horizontal.

Figure 6.1. Orifice plate. (from Bentley J. P. Principles of Measurement Systems, Longman, 1995, p. 286):

An equation for conservation of mass flowrate is as follows:

   (6.1)

Since 
               (6.2)

then, we can give an equation for conservation of volumetric flowrate
   (6.3)

When a volumetric flow rate in a pipe (see Figure 6.2) increases, then the velocity of the fluid through the orifice should increase as well. Since SA>SB , then  vA<vB. Due to inertia the smallest cross-section area of the stream is not in the plane of the orifice itself, but some distance downstream from it. The total energy of the stream is equal to the sum of its kinetic energy and static head of the stream.

Figure 6.2. Orifice-type differential pressure flowmeter.

Since the kinetic energy increases (due to the increasing of the velocity of the stream in cross-section B - B), then the static head should decrease. This static head is responsible for the static pressure of the stream. Therefore, there is a head difference in two cross-sections (ΔP=PA-PB), namely the differential pressure, which is the function of the velocity and finally of the flowrate of the stream. It means that for each value of the flowrate corresponds a certain value of a differential pressure. Therefore, we can measure this differential pressure and, finally, evaluate the required value of the flowrate. 

Equations for potential and kinetic energies of the fluid stream and work performed by it are as follows (from Bentley J. P. Principles of Measurement Systems, Longman, 1995, p. 280):


Combine equations (6.4) - (6.5) and get an equation for the conservation of the total energy per unit mass of the stream for the case of two cross-sections A  -  A  and B - B:

(6.7)
or, since the pipe is horizontal (the assumption 6)

then 

From equation (6.9) we can get an expression for the velocity of the stream in the cross-section B - B:

A theoretical equation for the flow of a fluid is as follows:

(6.12)

Frictionless flow is only approached at well-established turbulent flows. We are not able to measure SAand SB, which vary with the variation of fluid flowrate. So, we need to modify equation (6.12) and get a practical equation for the evaluation of fluid volumetric flowrate:

(6.13)
In the above equations we used the following parameters:


Case 2. Compressible fluid.

 
In this case the density of a fluid depends on pressure in the form (from Bentley J. P. Principles of Measurement Systems, Longman, 1995, p. 287):

From (6.14) we have:
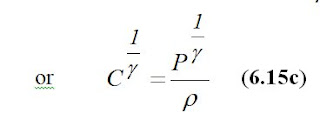
Let’s integrate an expression  
 Then: 
Now we can re-write Bernoulli equation in the following form:

(6.16)
or, since zA=zB then,

(6.17)
During the flow of a compressible fluid we have:


(6.18)
and therefore,  
(6.19)

So, 
(6.20)
and 
(6.21)

Therefore, mass flowrate is used in gas metering. A theoretical equation for a compressible flow has the following form:

(6.22)

A practical equation for a compressible flow has the following form:

(6.23)

where, the expansibility factor has the following form according to BS 1041 and ISO 5167 (from Bentley J. P. Principles of Measurement Systems, Longman, 1995, p. 288):

(6.24)
For liquids   ꜫ =1.0     

Below are given equations and data, which should be used during calculations of flowrates when orifice plates are used.

Discharge coefficient data for orifice plate, BS 1042.

The Stolz equation:

(6.25)
If
(6.26)
then, 
(6.27)
For corner tappings:

(6.28)
For flange tappings:
(6.29)

a). Conditions of validity for corner taps:

b). Conditions of validity for flange taps:


To calculate the value of Dor one need to perform several iterations until this value is obtained with the accuracy equal to the tolerance  δ  of machining of the surface of an orifice.

Step 1. Calculate Re.
Step 2. Set initial guess for parameters as follows: C=0.6, ꜫ =1.0 , E=1.0
Step 3. Calculate area Sor of the orifice hole using (6.13) or (6.23) and value of maximum flowrate.
Step 4. Calculate Dor.
Step 5. Calculate β.
Step 6. Revise the value of E according to 


Step 7. If we have liquid, then ꜫ =1.0. Evaluate C according to (6.25). Then continue starting from step 3, and so on.
Step 8. If we have gas, then if

evaluate according to (6.24). Evaluate C according to (6.25). Then continue starting from step 3, and so on.
Step 9. Check if Dor. >=12.5mm .
Step 10. Check if final values of β and Re are within limits.

Article Source:: Dr. Alexander Badalyan, University of South Australia

Read more...

Basics of Instrumentation & Control


To view more posts on BASICS : CLICK HERE

Pressure


To view more posts on PRESSURE : CLICK HERE

Flow


To view more posts on FLOW : CLICK HERE

Level


To view more posts on LEVEL : CLICK HERE

Temperature


To view more posts on TEMPERATURE : CLICK HERE

Analytical Instrumentation


To view more posts on Analytical Instrumentation : CLICK HERE
Related Posts Plugin for WordPress, Blogger...

About This Blog

Hai friends…welcome to my blog. This blog is exclusively for instrumentation engineering students which will provide sources for their reference and studies. As you all know Instrumentation is now a fast emerging and developing field in Engineering. This blog has different categories like PLC, SCADA, DCS, Sensors and Transducers, Computer control of process, Industrial Instrumentation, etc.

This blog will also provide an exclusive ‘ASK ME’ section where you can make any queries and share your ideas about instrumentation. The solution for your queries will be given to you by mail from best of my knowledge and reference.

So I wish this blog may be very useful for your studies and reference.

About Me

Keep In Touch

Follow Me!

Online Queries


Popular Posts